 Lýsigagnagátt
boundaries
Type of resources
Available actions
Topics
INSPIRE themes
Keywords
Contact for the resource
Provided by
Years
Formats
Representation types
Update frequencies
status
Scale
Resolution
-

Riparian zones represent transitional areas occurring between land and freshwater ecosystems, characterised by distinctive hydrology, soil and biotic conditions and strongly influenced by the stream water. They provide a wide range of riparian functions (e.g. chemical filtration, flood control, bank stabilization, aquatic life and riparian wildlife support, etc.) and ecosystem services. The Riparian Zones products will support the objectives of several European legal acts and policy initiatives, such as the EU Biodiversity Strategy to 2020, the Habitats and Birds Directives and the Water Framework Directive. Land Cover/Land Use (LC/LU) classification is tailored to the needs of biodiversity monitoring in a tailored buffer zone along large and medium-sized European rivers (with Strahler levels 3-8 derived from EU-Hydro). LC/LU is extracted from VHR satellite data and other available data in a buffer zone of selected rivers. The classes follow the pre-defined nomenclature on the basis of MAES typology of ecosystems (Level 1 to Level 4) and Corine Land Cover, providing 80 distinct thematic classes with a Minimum Mapping Unit (MMU) of 0.5 ha and a Minimum Mapping Width (MMW) of 10 m. The production of the Riparian Zones products was coordinated by the European Environment Agency in the frame of the EU Copernicus programme.
-

Línurnar sýna friðunarsvæði, þar sem eldi laxfiska (fam. salmonidae) í sjókvíum er óheimilt skv. auglýsingu nr. 460/2004.
-
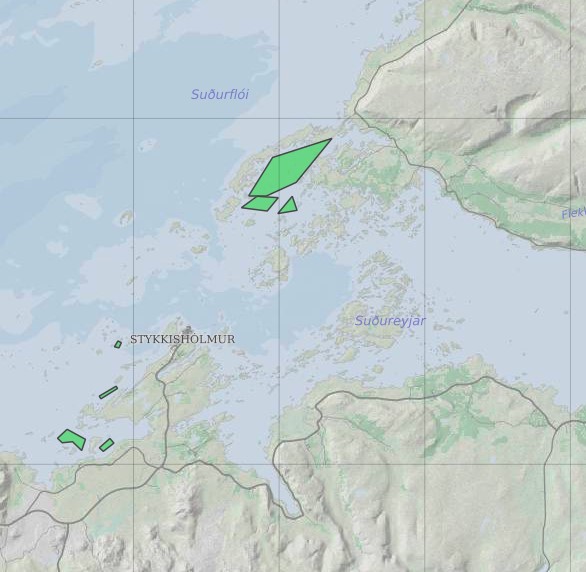
Ræktunarsvæði er afmarkað svæði sjávar nægjanlega stórt til að rúma þann ræktunarbúnað sem notaður er á viðkomandi svæði. Yfirleitt er um að ræða línur sem strekktar eru á milli flot bauja eða sérstaka ræktunarfleka með lóðréttar ræktunarlínur fáeina metra niður undir yfirborð sjávar . Svæðið er merkt með löglegum sjómerkjum þannig að sjófarendur eiga að geta varast þau, enda einnig merkt inn sjókort Landhelgisgæslunnar. Einungis er ræktuð Bláskel (Kræklingur).
-

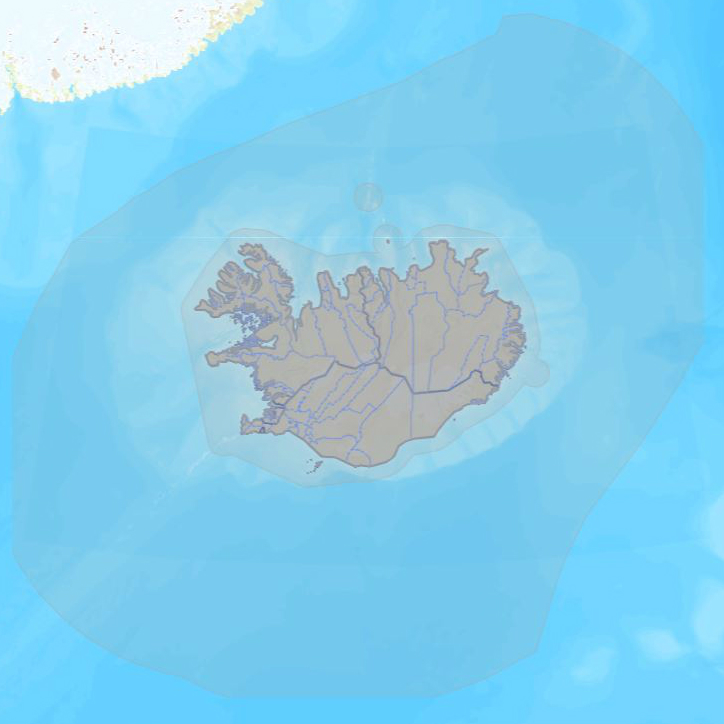
The combined Water and Wetness product is a thematic product showing the occurrence of water and wet surfaces over the period from 2009 to 2015. Two products are available: o The main Water and Wetness (WAW) product with defined classes of (1) permanent water, (2) temporary water, (3) permanent wetness and (4) temporary wetness. o The additional expert product: Water & Wetness Probability Index (WWPI) The products show the occurrence of water and indicate the degree of wetness in a physical sense, assessed independently of the actual vegetation cover and are thus not limited to a specific land cover class and their relative frequencies. A verification of the Water and Wetness layer was performed by the Institute of Nature Research during autumn of 2018 and the data and resulting report are made available on the NLSI websites.
-

Landinu skal skipt upp í eftirfarandi heilbrigðisumdæmi, sbr. reglugerð 387/2015: Heilbrigðisumdæmi höfuðborgarsvæðisins. Heilbrigðisumdæmi Vesturlands. Heilbrigðisumdæmi Vestfjarða. Heilbrigðisumdæmi Norðurlands. Heilbrigðisumdæmi Austurlands. Heilbrigðisumdæmi Suðurlands. Heilbrigðisumdæmi Suðurnesja. Í heilbrigðisumdæmum landsins starfa eftirfarandi heilbrigðisstofnanir: Heilsugæsla höfuðborgarsvæðisins, innan heilbrigðisumdæmis höfuðborgarsvæðisins. Heilbrigðisstofnun Vesturlands, innan heilbrigðisumdæmis Vesturlands. Heilbrigðisstofnun Vestfjarða, innan heilbrigðisumdæmis Vestfjarða. Heilbrigðisstofnun Norðurlands, innan heilbrigðisumdæmis Norðurlands. Heilbrigðisstofnun Austurlands, innan heilbrigðisumdæmis Austurlands. Heilbrigðisstofnun Suðurlands, innan heilbrigðisumdæmis Suðurlands. Heilbrigðisstofnun Suðurnesja, innan heilbrigðisumdæmis Suðurnesja.
-

Gögnin sýna hvar bráðamóttökur, læknavaktir og heilsugæslustöðvar eru staðsettar á landinu. Um er að ræða samstarfsverkefni Embættis landlæknis og heilsugæslunnar á höfuðborgarsvæðinu.
-

Eftirfarandi landshlutar eru sóttvarnaumdæmi, sbr. reglugerð 387/2015: Höfuðborgarsvæðið (Reykjavíkurborg, Seltjarnarnesbær, Kópavogsbær, Garðabær, Hafnarfjarðarkaupstaður, Mosfellsbær, Kjósarhreppur og fyrrum sveitarfélagið Þingvallasveit). Vesturland (Akraneskaupstaður, Hvalfjarðarsveit, Skorradalshreppur, Borgarbyggð, Eyja- og Miklaholtshreppur, Snæfellsbær, Grundarfjarðarbær, Helgafellssveit, Stykkishólmsbær, Dalabyggð, Reykhólahreppur, Strandabyggð, Kaldrananeshreppur, Árneshreppur og Húnaþing vestra). Vestfirðir (Vesturbyggð, Tálknafjarðarhreppur, Ísafjarðarbær, Bolungarvíkurkaupstaður og Súðavíkurhreppur). Norðurland (Húnavatnshreppur, Blönduósbær, Skagabyggð, Sveitarfélagið Skagaströnd, Sveitarfélagið Skagafjörður, Akrahreppur, Fjallabyggð, Dalvíkurbyggð, Hörgársveit, Eyjafjarðarsveit, Akureyrarkaupstaður, Svalbarðsstrandarhreppur, Grýtubakkahreppur, Þingeyjarsveit, Norðurþing, Tjörneshreppur, Skútustaðahreppur, Svalbarðshreppur og Langanesbyggð að frátöldum fyrrum Skeggjastaðahreppi). Austurland (Vopnafjarðarhreppur, Fljótsdalshérað, Fljótsdalshreppur, Borgarfjarðarhreppur, Seyðisfjarðarkaupstaður, Fjarðabyggð, Breiðdalshreppur, Djúpavogshreppur og fyrrum Skeggjastaðahreppur). Suðurland (Sveitarfélagið Ölfus, Hveragerðisbær, Grímsnes- og Grafningshreppur, Bláskógabyggð að frátöldu fyrrum sveitarfélaginu Þingvallasveit, Hrunamannahreppur, Sveitarfélagið Árborg, Flóahreppur, Ásahreppur, Skeiða- og Gnúpverjahreppur, Rangárþing ytra, Rangárþing eystra, Mýrdalshreppur, Skaftárhreppur, Sveitarfélagið Hornafjörður og Vestmannaeyjabær). Suðurnes (Sandgerðisbær, Sveitarfélagið Garður, Reykjanesbær, Grindavíkurbær og Sveitarfélagið Vogar).
-

Þekjan sýnir orkuspársvæði sem koma fram í orkuspá Orkustofnunar. Það eru svæðin Suðurnes, Reykjavík, Vesturland, Vestfirðir, Norðurland, Austurland og Suðurland. Svæðin eru aðeins öðruvísi en í hefðbundinni landshlutaskiptingu þar sem sú skipting er til komin vegna uppbyggingar flutningskerfisins.
-
Í markalaginu eru ýmis mörk lands og eru þetta allt flákalög og þau sýna eftirfarandi: skiptingu landsins eftir sveitarfélögum, skiptingu landsins eftir umdæmi sýslumanna, lögregluumdæmi og skiptingu landsins í dómstóla í héraði.
-

Eldissvæði er svæði sem úthlutað er rekstarleyfishafa. Rekstrarleyfishafi hefur þá heimild til að hafa eldisbúnað til að ala fisk innan þess svæðis skv. skilyrðum rekstrarleyfisins.