 Lýsigagnagátt
Náttúrufræðistofnun
Type of resources
Available actions
Topics
INSPIRE themes
Keywords
Contact for the resource
Provided by
Years
Formats
Representation types
Update frequencies
status
Service types
Scale
Resolution
-

[IS] WMS þjónusta fyrir drónamyndir frá Landmælingum Íslands. [EN] WMS service to serve drone imagery from the national land survey of Iceland.
-
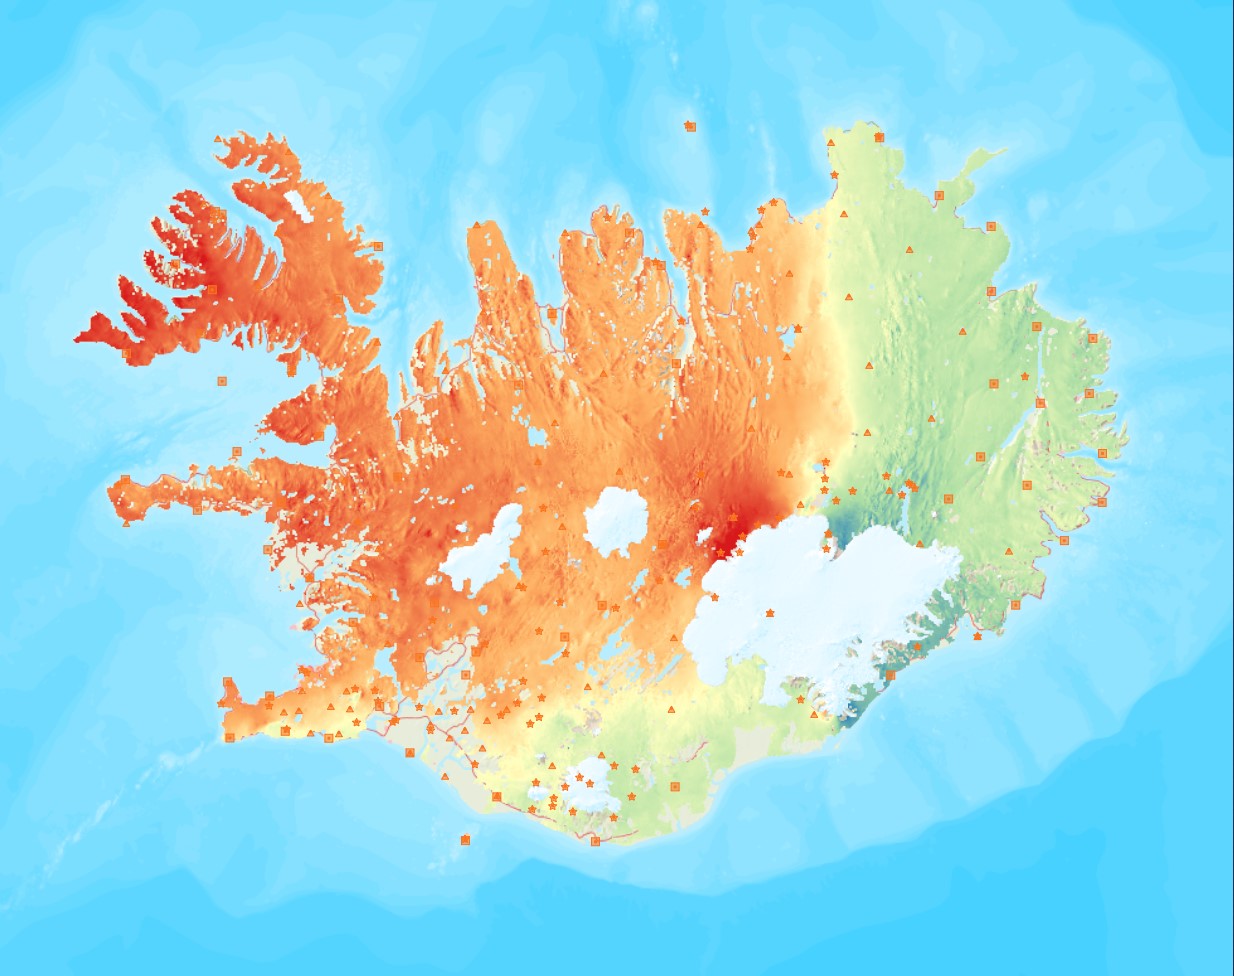
Average near-East crustal velocities between summer 2015 and summer 2018. These velocities indicate velocities in the East direction. However, they could be slightly influence by velocities along the North and Up directions and are therefore called near-East. Near-East velocities were derived by decomposing the line-of-sight velocities of six Sentinel-1 interferometric time-series covering Iceland. These time-series used a single master approach and Sentinel-1 images from the following summers (mid-June to end of September): 2015, 2016, 2017, and 2018. The near-East velocity grid has a 50 m resolution.
-

Skoðunarþjónustur í samræmi við INSPIRE tilskipunina og lög um grunngerð fyrir stafrænar landupplýsingar
-

IS: Í Kortasjá Náttúrufræðistofnunar er meðal annars hægt að velja kort með örnefnum, loftmyndir, atlaskort eða AMS kort. Þá er þar að finna sveitarfélagakort með upplýsingum um stærð sveitarfélaga og íbúarfjölda, þekju með CORINE landflokkun sem sýnir til dæmis mólendi eða mýrlendi og gamlar ljósmyndir danskra landmælingamanna sem og gamlar bæjarteikningar. EN: Kortasjá from Institute of Nature Research is a simple and reactive map where the user can view placenames, protected areas, Corine classification, roads, height points, buildings, boundaries of municipalities, and more.
-

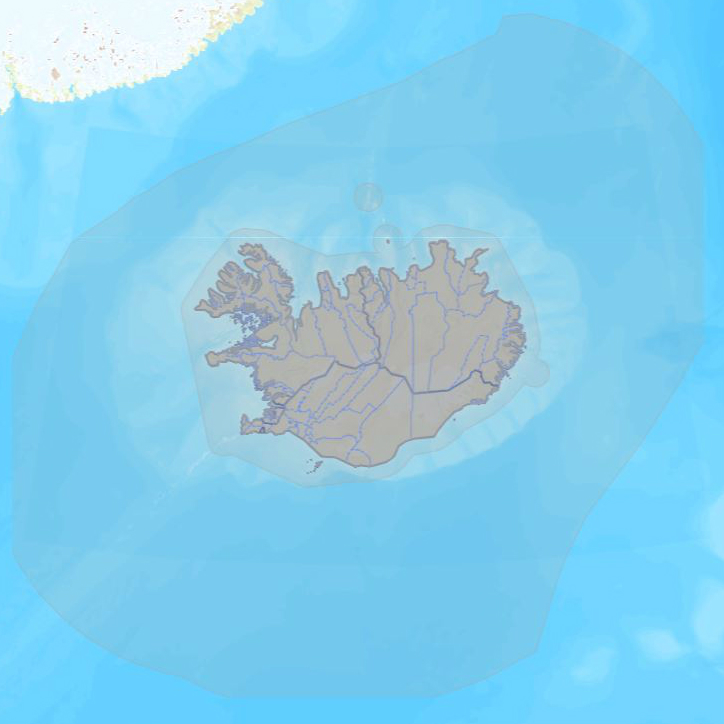
Íslenska: Vetrarfuglatalningar eru ein lengsta samfellda vöktun sem stunduð hefur verið hér á landi og sú sem tekur til flestra fuglategunda. Frá upphafi hafa áhugamenn unnið þetta verk í sjálfboðavinnu og á annað hundrað manns taka þátt. Talningar fara fram á föstum dögum í kringum áramót. Markmið vetrarfuglatalninga er að safna upplýsingum um fjölda og dreifingu fugla að vetrarlagi. Talningar eru staðlaðar og nýtast til vöktunar einstakra stofna. Gögnin sýna þau svæði á Íslandi þar sem fuglar eru taldir á veturna og númersvæðanna sem eru talin. Sjá niðurstöður vetrarfuglatalninga: https://www.natt.is/is/vetrarfuglatalningar-nidurstodur English: Winter bird counts are one of the longest-running continuous monitoring efforts in Iceland and the one that covers the greatest number of bird species. From the beginning, this work has been carried out by volunteers, with around a hundred people participating. The counts take place on fixed dates around the New Year. The aim of the winter bird counts is to collect information on the number and distribution of birds during the winter. The counts are standardized and are used to monitor individual populations. The data show the areas in Iceland where birds are counted during the winter, as well as the numbered survey areas included in the counts.
-
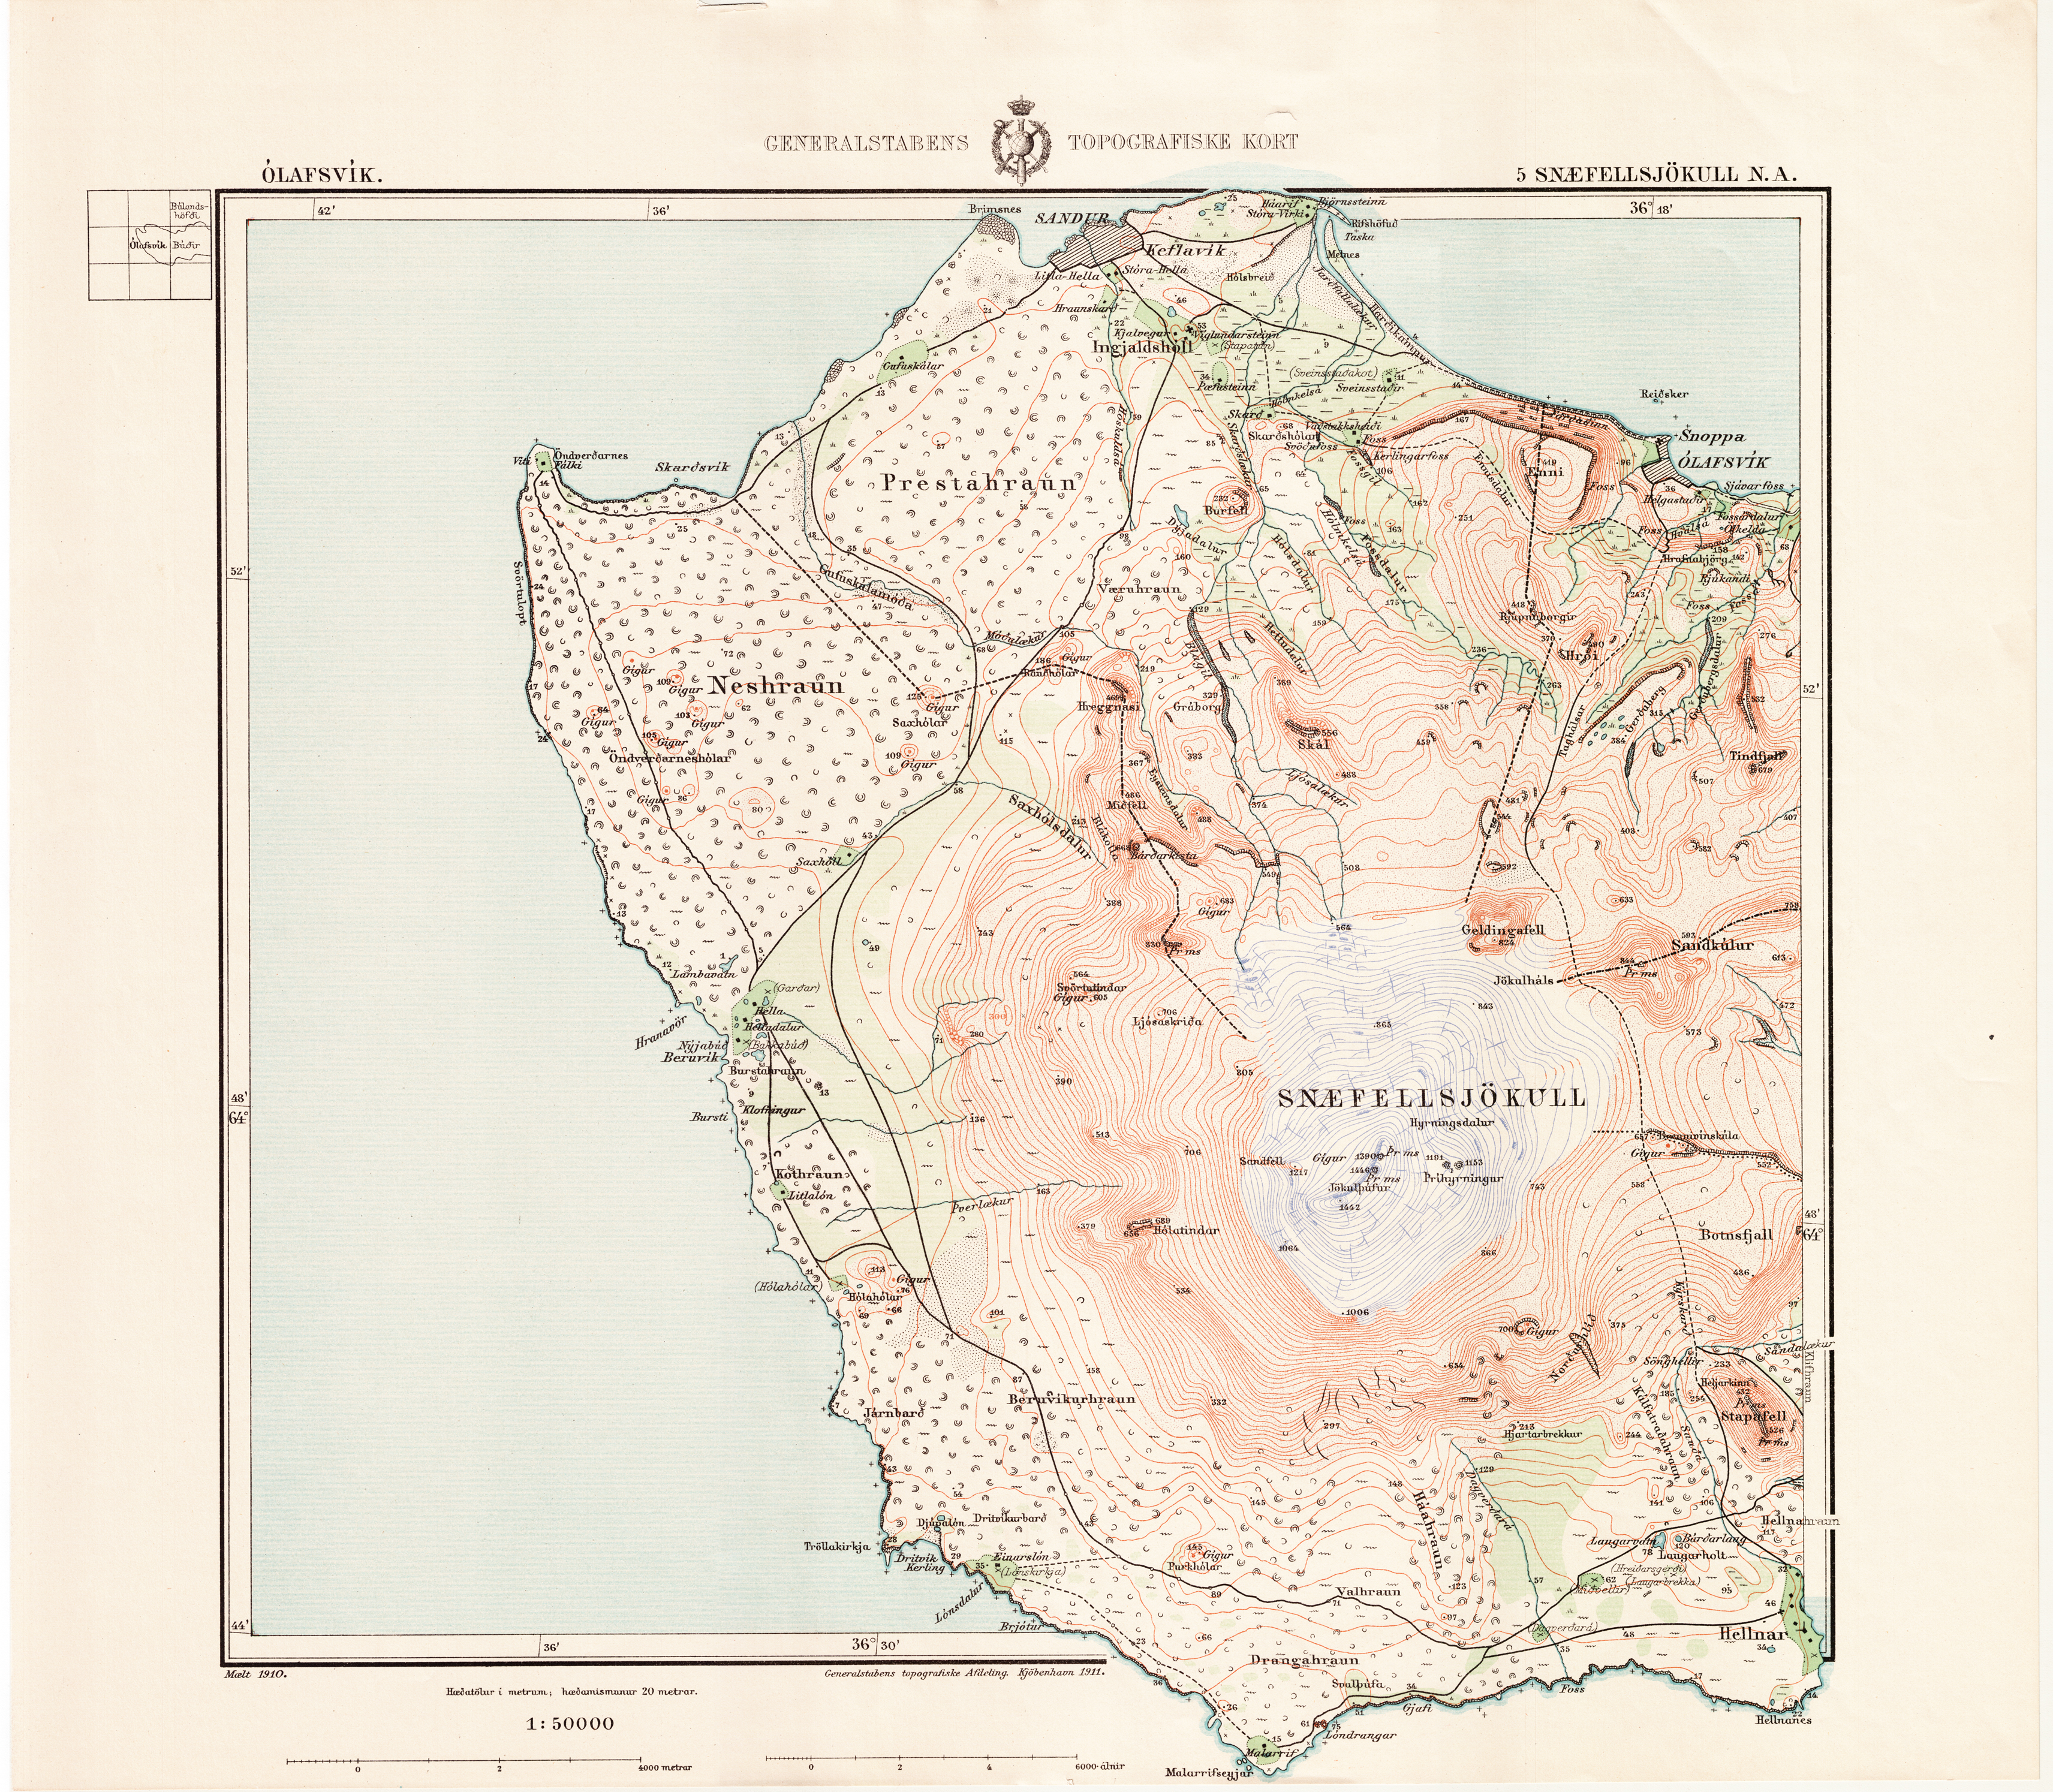
Nú hafa Náttúrufræðistofnun útbúið vefkort með því að staðsetja og klippa saman hin svokölluðu Herforingjaráðskort. Eftirfarandi lýsing á Herforingjaráðskortum er tekin af vef Landsbókasafns: Á síðasta áratug 19. aldar varð dönskum yfirvöldum ljóst að þau kort sem til voru af Íslandi stæðust ekki þær kröfur sem gera þyrfti í samfélagi þess tíma. Bestu kort af Íslandi sem buðust voru í stórum dráttum byggð á strandmælingum danska sjóhersins sem fram fóru á árunum 1801-1818 annars vegar og hins vegar á kortum Björns Gunnlaugssonar sem byggð voru á fyrrnefndum strandmælingum og eigin mælingum Björns á árunum 1831-1843. Á fjárlögum 1899 voru veittar 5000 krónur og skyldi hefja nýjar þríhyrninga- og strandmælingar á Reykjanesi. Árið 1900 var gefin út í Danmörku tilskipun um að sendur skyldi leiðangur til Íslands til að mæla hér grunnlínu og hnattstöðu. Síðan var ætlunin að mæla þríhyrninganet út frá nýju grunnlínunni. Hingað voru sendir danskir liðsforingjar og sumarið 1900 var unnin ýmis undirbúningsvinna. Árið 1902 höfðu fjárveitingar verið auknar svo að rétt þótti að hefjast handa. Byrjað var á Hornafirði og mælt vestur ströndina og um lágsveitir Suðurlands en uppsveitum og hálendi frestað. Verkinu var svo haldið áfram tvö næstu árin en féll niður 1905 vegna fjárskorts og annarra anna hjá Landmælingadeild danska herforingjaráðsins (Generalstabens topografiske Afdeling) er tókst verkið á hendur. Eftir eins árs bið var þráðurinn tekinn upp að nýju enda bættist nú við fjárstyrkur úr ríkissjóði Dana. Á árunum 1906-1914 var unnið öll sumur, nema 1909, þegar ekkert var aðhafst. Var þá lokið byggðamælingum sunnanlands og mælt um Vesturland, norður og austur um Húnaflóa. Árangurinn var 117 kortblöð af þriðjungi landsins, suður- og vesturhluta, í mælikvarða 1:50.000 (auk nokkurra sérkorta af afmörkuðum svæðum). Þau eru gjarnan nefnd herforingjaráðskortin í höfuðið á þeim sem stóðu fyrir gerð þeirra.
-
Í markalaginu eru ýmis mörk lands og eru þetta allt flákalög og þau sýna eftirfarandi: skiptingu landsins eftir sveitarfélögum, skiptingu landsins eftir umdæmi sýslumanna, lögregluumdæmi og skiptingu landsins í dómstóla í héraði.
-
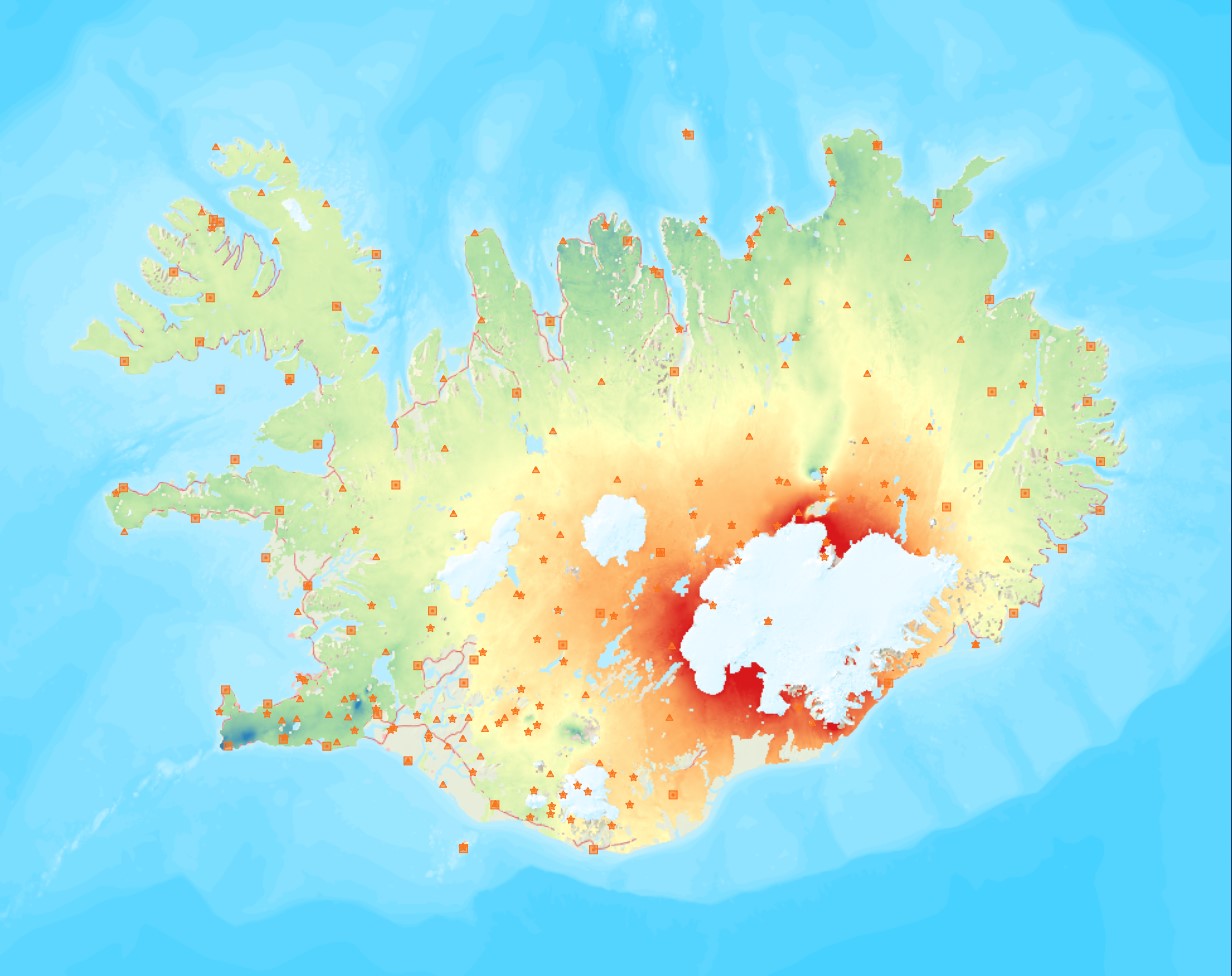
Average near-Up crustal velocities between summer 2015 and summer 2018. These velocities indicate velocities in the Up direction. However, they could be slightly influence by velocities along the East and North directions and are therefore called near-Up. Near-Up velocities were derived by decomposing the line-of-sight velocities of six Sentinel-1 interferometric time-series covering Iceland. These time-series used a single master approach and Sentinel-1 images from the following summers (mid-June to end of September): 2015, 2016, 2017, and 2018. The near-Up velocity grid has a 50 m resolution.
-
Niðurhalsþjónustur í samræmi við INSPIRE tilskipunina og grunngerð landupplýsinga
-

EN This shadow map illustrates terrain-induced shadows at 17:45 on August 12th, 2026. The solar eclipse will not be visible within the shaded areas. Shadow coverage may vary depending on the simulation resolution and the specific time. IS Skuggakortið sýnir staði þar sem skuggar falla klukkan 17:45 þann 12. ágúst 2026. Sólmyrkvinn mun ekki sjást á þeim svæðum sem eru í skugga. Skuggasvæðin geta verið breytileg vegna upplausnar hæðarkortsins og á öðrum tímum.